IISView - generate web site traffic statistics for IIS
IISView is a website statistics package for web hosts giving
detailed web traffic analysis by analyzing your web log.
Aims of IISView
Simple executable that can run every night and produce a simple set of
static web pages representing the traffic seen on the web site.
The web server supported is Microsoft's IIS.
Introduction to web server logfile analysis
There are two main types of web analytics technologies. One uses
embedded HTML tags to trigger counters, typically on a 3rd party site.
This popular technique has some disadvantages such as requiring changes
to your web pages, slowing down the page display as the links to the
analytics are executed and sometimes fees to be paid to the analytics
provider.
IISView uses the other common technique of analyzing the web logs
produced by the web server. These can contain information about the
visitor, and how they came to visit your site. IIS records all hits on
your site and can include time, URL visited and what page or site
referred them to you. In the case of search engines this tells you what
keywords the user keyed into the search query. In contrast to using a
3rd party page tagging, there are no monthly service fees. If you don't
run your own IIS web server, then your ISP may allow you access to the
logs. IISView can make use of remotely
collected logfiles. If you don't have a way of accessing the web
logs for your server, then IISView is not for you. Wikipedia has a
section on Web analytics.
IISView analyzes the logfiles produced by IIS and collates traffic
statistics in various categories. Some logging features are not
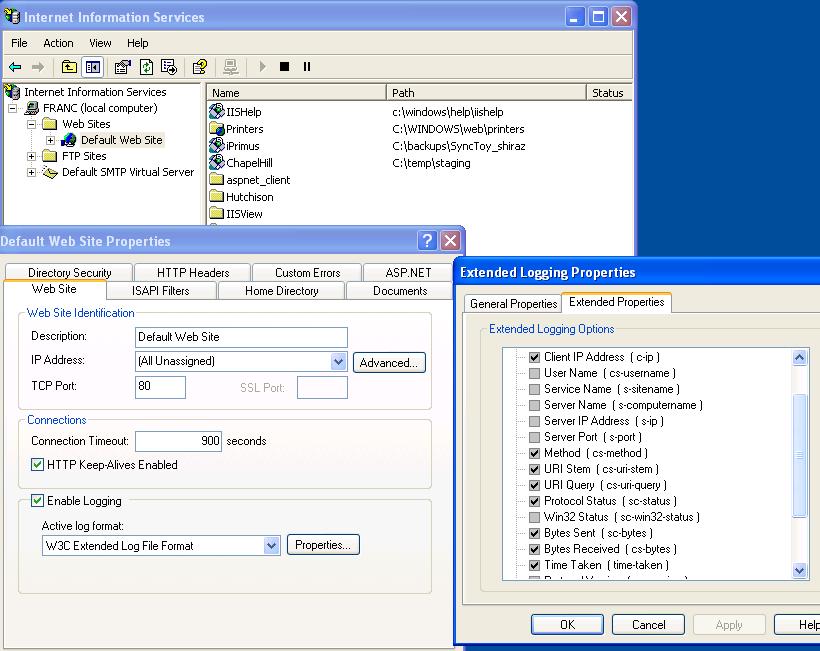
switched on in IIS by default, but these can be switched on easily in
the "Internet Information Services" "Administrative Tool".
Enabling referer, time taken and bytes sent in the logs make for much
more effective analysis results. IISView will report which countries,
and companies or service providers your visitors come from. IISView
will identify the busiest time of day, or days of the month for your
site, and identify when the response time you are providing to your
customer becomes poor, or when your customers are experiencing errors
from your site.
There is a wealth of information in the IIS weblogs. IISView will
help make sense of it all.
Features of 'usage' pages
- Automatically updates (e.g. nightly)
- Summary by month of hits, KBytes,
visitors
- For each month profile by hour and by day of hits, KBytes, error
rates and
server response time
- Monthly profiles of pages visited, file types, visitors,
referrers, search
engine keywords, browsers used including which are robots
- The busiest hour of the month compared to averages, the worst user
response time experienced
- Error rates and reasons
- Broken link reports
- Keywords from search engine referrals
- Spider/robot traffic component
- Visitor breakdown by country/domain and by company/ISP
- Profile visits by hits, length of stay, entry/exit pages,
non-robot.
- Breakdown by browser type (e.g. IE, Firefox, Opera..), and by
Operating System
- Operates with the IIS log files already on your server and
doesn't
require modification of pages to include references to other sites.
(There is no limit on the number of pages profiled
and no fee to count the pages. There are no ongoing costs or expenses.)
- GMT vs local timezoning support. (i.e. to match the IIS "Use
local time for file naming")
- (optionally) report usage by logged in users
- Support for multiple web sites hosted on the same IIS installation
- (optionally) exporting to comma separated variables format for
doing further analysis
- (optionally) on-demand reports for date ranges within a month
- Filtering of input records
Sample generated pages
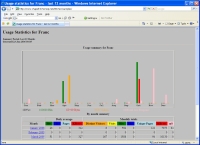
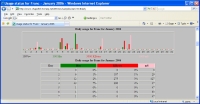
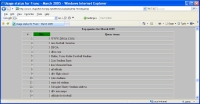
Here are some sample generated usage pages produced
by the IISView analysis of actual web logs
.
Installation instructions
Before you download, have a read of the
instructions, since there is presently no wizard.
System requirements
- Windows - 2000, XP(Pro), 2003 Server, Vista(Business/Ultimate),
2008 server.
- 10Mb free disk space.
- Web browser - one of Internet Explorer, Firefox, Safari, Opera
- Administration privileges for installation and configuration,
normal user for operation.
Upgrading
If you are upgrading from an earlier version, please uninstall the
earlier version first -
- Use "Control Panel → Add or Remove Programs → IISView",
- delete History.txt from the generated files directory (e.g. C:\InetPub\wwwroot\Usage),
- Install as below,
- run "Catch-up" to regenerate
the preceding year's history.
Step by step
What you have downloaded is a WinZip self installer for IISView. Please
"Save" and virus scan on your own system before "Run".
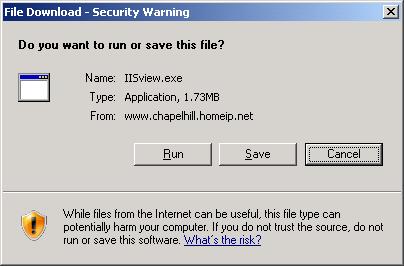
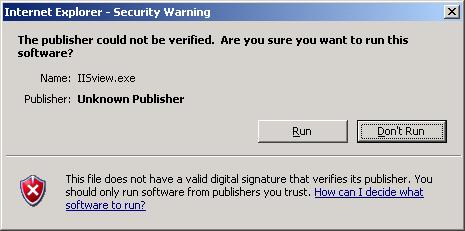
"Run" for the "Unknown Publisher" warning
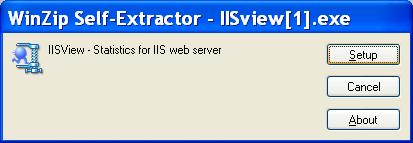
Run the Self-Extractor part of the installer "Setup" / "Unzip"
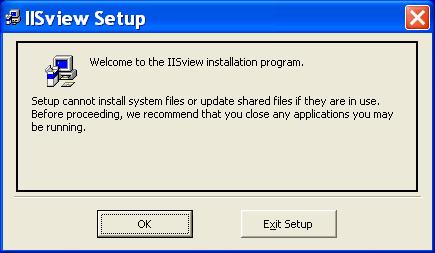
Proceed with the install as below.
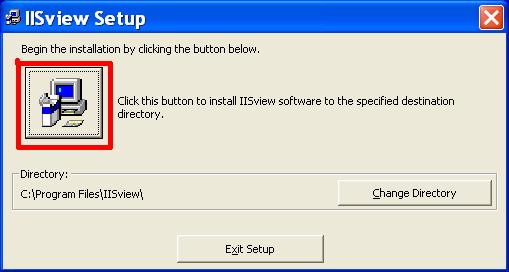
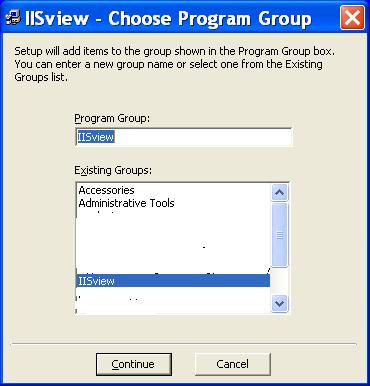
Post-installation configuration
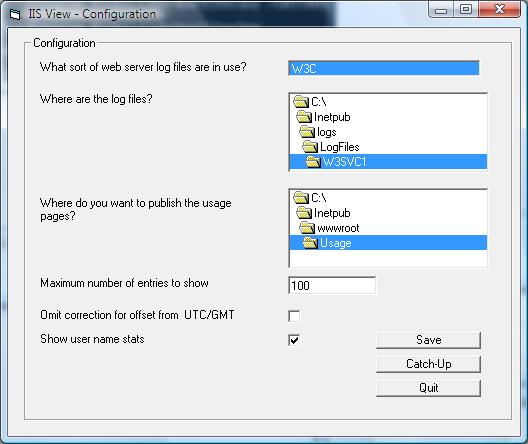
Run IISView.exe (interactively)
- Start → All Programs →
IISview →
IISview
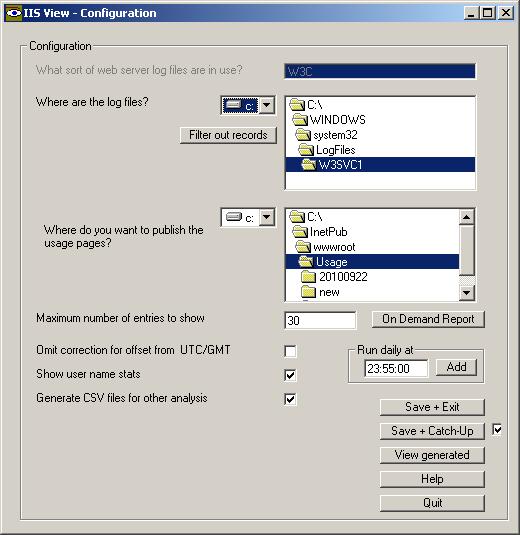
- For reference also start the IIS administration tool
Start → Control Panel →
Administrative Tools → Internet Information Services
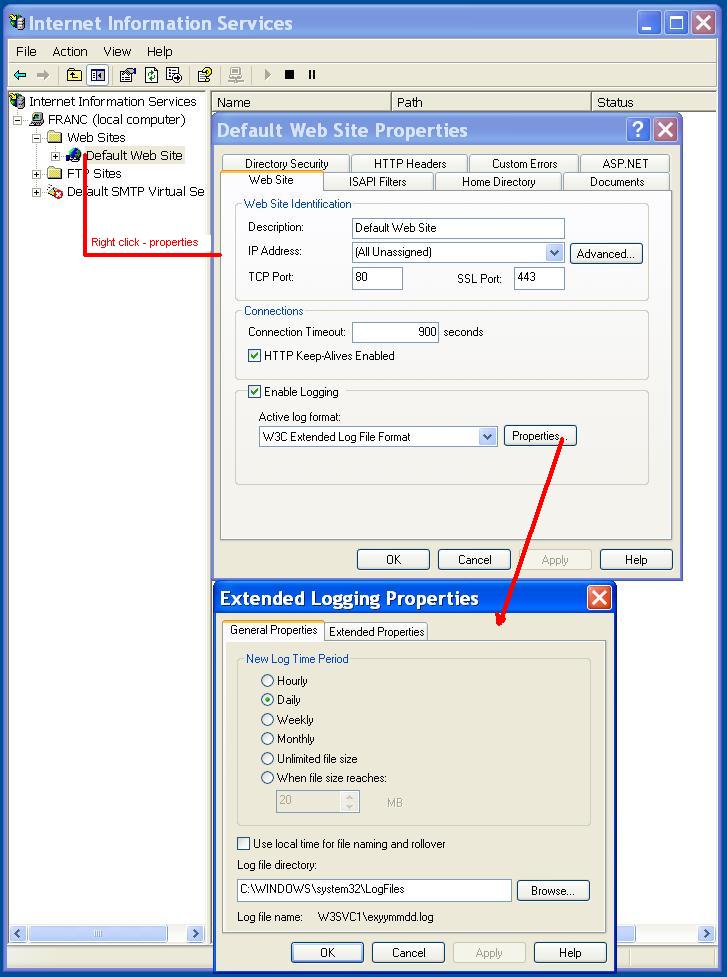
- Select the WEB log type (For IIS run up Internet Information
Services, select _the_ website, and click properties. The "Web Site"
tab has an Active log format. IISview supports W3C format. Logging must
be enabled.
In IIS7 under Vista, the GUI for configuring the items logged is not
provided. However there is an add-in available, Logging
UI
for
IIS
7.0
on
Windows
Vista.
In IISView
- Select the file location where "Log file directory" is found.
- Select the directory for the usage statistics to be published
from. The simplest option is to create a directory under the "Home
Directory" "Local Path"
e.g. C:\InetPub\wwwroot\Usage
(Do not choose the root folder for your web site or some of your files
will be overwritten by IISView!)
However if you
want to put it elsewhere that is fine, but you will need to create a
"Virtual Directory" under the web site.
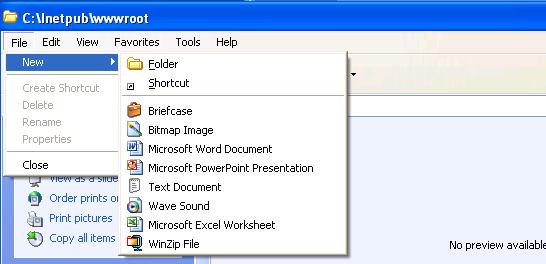
(You will get errors if you don't create the standard directory
initially, but after the first save all will be OK).
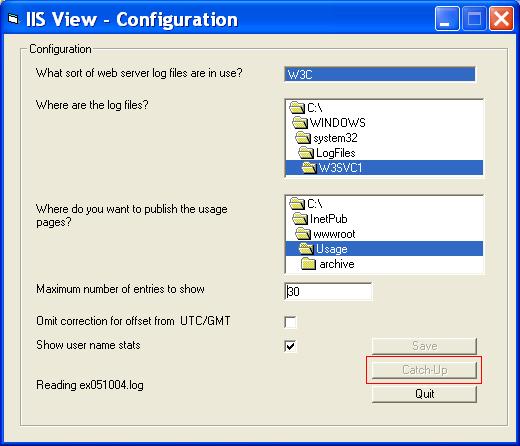
- Click "Catch-up" to
process all the existing log files. Normally
just this months files are processed. Progress is shown in the lower
left section of the window.
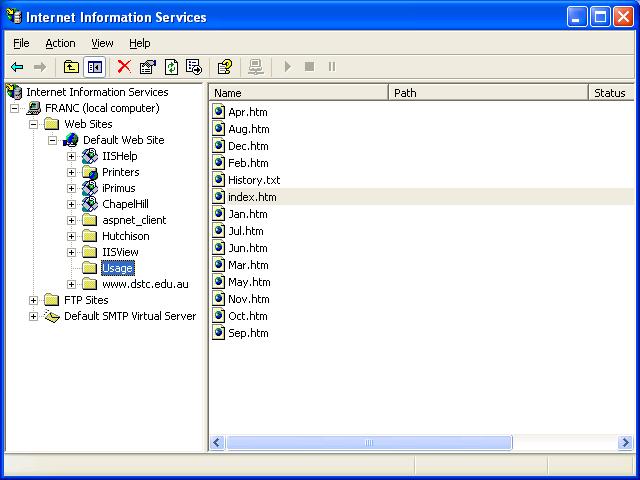
- Check that the initial catch up has created a set of pages.
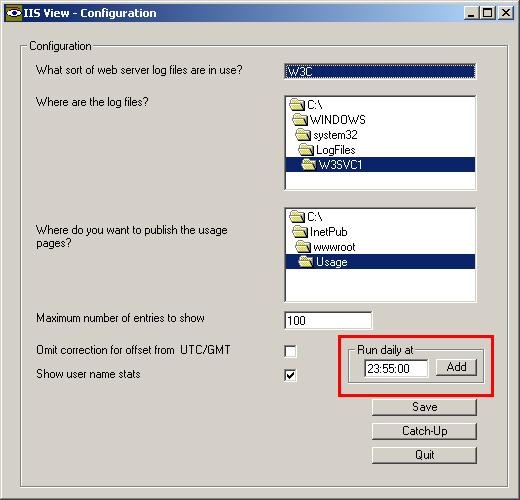
- Select a time of day to generate the reports including the
preceding day. (e.g. just before midnight). Enter the desired
time and "Add". The job will now appear in the Control Panel
→ Scheduled Tasks
(An alternative is to use the
Windows task scheduler.)
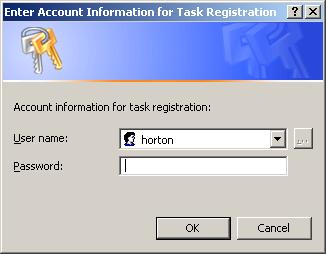
- You will be prompted for the username and password for the
scheduled task to be run as. This should be you!
- Just let it run in the background under the scheduled task, and
the usage web pages will be automatically updated.
- Remember if you change your password, then you have to go into
all your scheduled tasks, like IISView, and updated the password in the
task credentials.
Special notes for IIS7 on Vista and Windows Server 2008.
On Windows Vista (IIS7) the log file locations have moved and you will
also need to
enable read permissions for user executing the scheduled task.
The log
files are now in C:\Inetpub\logs\LogFiles\W3SVC1.
This
will
have
to
be
readable
by
the windows user running IISView e.g.
cacls C:\inetpub\logs /E /G user:R
Additionally you will
have to set the permissions (or just ownership) on the Usage directory
to allow read for
web server, and full control for the user executing the scheduled task.

Multi-site support
IISView can support IIS servers that run multiple web sites from the
same installation. An IISView "site" has a simple one word name that is
used to name the configuration of the LogFile and output directories
etc. Start IISView using the multi-site option
Start → All Programs →
IISview →
IISview (Multi-site)
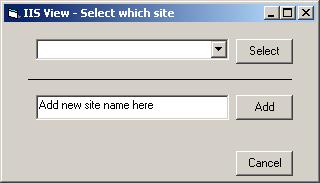
The default IISView site is "INI". To add additional
configurations, enter a site name and Add. Subsequently, this site name
will be available in the pull-down list, which you can then select. The
configuration looks like above, but the site name appears on the
Configuration label, event log trace, and in the title of the usage
pages.
On Demand Reports
The first of new on-demand reports allows you to look at a specific
date range within a month over the last few years. So if you introduced
a campaign on a particular date, you can see how the traffic looked
before and after. The "Custom" report will appear in the same folder as
other usage reports, but will be named with the "Custom" name you
enter, Start with the "On Demand Report"
button.
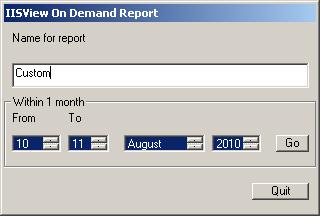
Select the start and end days, month and year and press "Go". Progress through the report
generation is shown in the lower left of the main configuration window.
When complete, the report will be available in the Usage folder and
named Custom.htm.
Command line options
IISView can be started from a command prompt. The available options are
- /BATCH
- Do not show the configuration window, and process the log records
for the current month. This is used to perform the daily update.
- /CATCHUP
- Do not show the configuration window. Update the usage reports
with log files for the previous year.
- /LISTSITES
- Select the site to be configured from the list of currently
available sites, or a new site.
- /SITE=siteName
- Configure or process logs for "siteName" instead of the
default site (INI).
- /VERSION
- Display the version of IISView.
Input filters
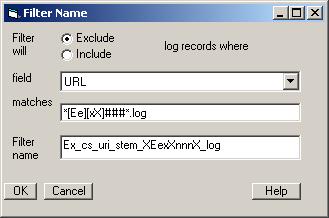
Site reports can be customized to exclude log records, or include
specific log records based on the values of the IIS fields. IISView
looks at each record from IIS and applies the filter before adding to
the statistics. On the main configuration window select "Filter out records".
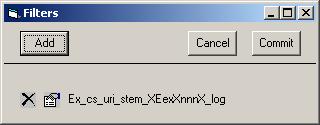
Press "Add" for a new filter,
or delete or edit an existing filter rule.

The fields that can be filtered are :-
- Client IP
- Method (GET/PUT etc)
- Referrer
- HTTP Status (200/404 etc)
- Query
- URI (the file being served)
- User agent (i.e. the browser)
The pattern the field matches allows use of the following expressions :-
?
|
Match any single character
|
*
|
Match zero or more characters.
as in *robot*
|
[list]
|
Any single character in list
e.g. [a-zA-Z]
|
[!list]
|
Any single character not in the
list
|
The filter name should describe the reasoning for the filter, but an
automatically generated name is supplied if left empty.
If you want to have reports with different filters applied or with no
filters, use the multi-site facility.
Download IISView
To be notified of new versions of
IISView,
receive an email when this page
changes.
Alternatives
All suggestions and bug reports should be submitted to David Horton.
If the statistics that you want to see are not present, or are zero or
blank, it could be
- I haven't implemented them yet,
- they aren't switched on in the IIS logging. Try enabling in
Extended Properties in IIS.
Refer to the Windows Application Event Log for diagnostic messages.
Long run-times have been observed where
- the list size is configured large, and there are a lot of
different visitors to the site. The reverse DNS lookup on each IP
address is time-consuming. (Try reducing the list size).
- there is a large and complex traffic profile. (Long lists are not
handled as efficiently as may be desired). All the log files for a
month are reprocessed each day, so this gets slower towards the end of
the month. However previous months are not regenerated until next year.
(Try
running in the early hours of the morning, or when the CPU load doesn't
affect others.)
On windows server 2008 the /BATCH overnight task reports errors in the
Windows event viewer, but runs fine from GUI.
- Open the job in the task scheduler and confirm the password is
current for the user.
- While there, change the "Configure for:" from "windows xp or 2003
server" to "Vista and Server 2008"
| This is IISView.
But if you host multiple web sites, IIS Farm View will track traffic, response times and error rates so you can see where to drill down. |
|
